How to: create an infographic in almost a day
does it have to be an infographic?
really?
ok, look for reference. pick your favourite and study it. How many fonts have they used? how many swatches? Stay away from the moors of pinterest, you’ll get lost in there for days.
use this infographic as reference. not stylistically (that’s cheating) but for size and spacing etc. scroll down to the end: was that too long? remember the attention span of people on the internet is very short. For me i’d probably spend 15-20 seconds reading an infographic and about 2:00 watching a youtube.
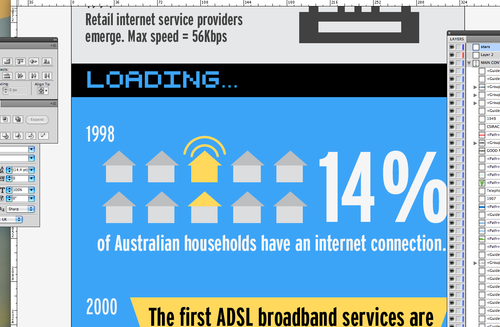
using illustrator, set up the size of the doc, and the type size you’ll be using (use the other infographic for reference) and flush it with all your ‘dot points’. ( it’s handy to seperate your information into chunks - because it’s easier too design, and that’s how people read stuff.
use the brush tool to quickly to paint in where you’ll drop little illustrations.
scroll through it, it should read well, have enough breathing space and make sense. this is the skeleton of your infographic.
okay all that should have taken you a few hours. have a pepsi max or something.
work your way down as quickly as possible. don’t spend longer than 10-20 min on each section (which is about three sentences of text. don’t worry too much about colours, but it helps to pick something soft.
it helps to ‘block’ sections with different colour backgrounds so all the info doesn’t mush together.
don’t worry about layers just get to the bottom of this beast you have created.
take a break.
Use shutterstock for things which are generic and annoying to trace or draw yourself eg. the world. most of the other things you’ll need should be easy to trace or sketch like a city skyline, and you can match this too your doc with an interesting colour pallette.
work all the way back to the top, slowly. zoom in to about 600% and tweak. this means kerning, spacing, colour alterations, deleting, pathfinder and fitting everything to the artboard. As you slog through it, you should look for things that stick out like a colour which is too bright or font that looks out of place. You should minimize these things, if your colour pallete has 12 colours, cut it down to 8. 5 fonts? you can probably get away with one family/3-4 different weights. this will help tie it all together.
deleting: if something looks out of place on the way down, leave it. If it still looks weird on your second run, don’t hesitate to delete it. this isn’t a piece of art, it’s an infographic. you’ll waste too much time fixing up that wonky telephone or pair of sneakers, just trash it.
at this point you’ve spent too long looking at it, but it should look pretty nice, print it at 100% and look at it tomorrow.
comb over the print, there should be lots of mistakes to fix.
if you have time, try and drop in a few easter eggs. in the infographic i’m doing, there’s a section about mid 90’s browsers so i designed a windows 95 toolbar.
print again (optional) or just export to png and resize if needed. the great thing about illustrator is that the document size you start with can change at the end, you can scale it up 10% without any resolution problems.
done!